IEnumerable<T>をLINQでマッピング
小ネタ。
IEnumerable
超絶厳しいTwitter APIが承認された
Twitter APIを使いたいので申請したらいろいろとめんどくさかったんで備忘録として
最近の審査は結構厳しくなったみたいなので簡単な気持ちで申請したら思ったよりめんどくさかったんで一連の流れを記載します。ちなみに僕は英語が全く出来ませんが承認されたのでそんなに心配はいらないかと思います。
2018年9月7日 申請
申請したら返信がきました。
Thanks for applying for access!
In order to complete our review of your application, we need additional information about your use case. The most common types of information that can help expedite our review include:
The core use case, intent, or business purpose for your use of the Twitter APIsIf you intend to analyze Tweets, Twitter users, or their content, share details about the analyses you plan to conduct and the methods or techniques
If your use involves Tweeting, Retweeting, or liking content, share how you will interact with Twitter users or their content
If you’ll display Twitter content off of Twitter, explain how and where Tweets and Twitter content will be displayed to users of your product or service, including whether Tweets and Twitter content will be displayed at row level or aggregated
To provide this information to Twitter, reply to this email.
Thank you for your interest in building on Twitter.
ふむふむ(わからん)。
放置。。。
2018年12月20日 返信
とりあえず利用用途を答えろって言ってるっぽいんでそれなりの答えを返信した。
thank you for replying to my email.
On this site, Twitter's comments are posted using keywords such as song title and artist name.
For example, Twitter search with the keyword "Girls Like You" on the following URL, and place comments in real time.
https://mygkrnk.com/music/732
このURLでキーワードを使ってツイート検索するよ!って内容。
ものの30分ぐらいで返信が!
Thank you for your response.
At this time, we still do not have enough specific information about your intended use case to complete review of your application. As a reminder, we previously requested additional information about:
以下略
Twitter「マジで意味わかんねぇからもうちょっと詳しく説明してくんない?」
俺「。。。」
Quitaにいい記事が!
qiita.com
要はQ&A方式で返信すれば良いっぽい!
こんな感じで返信した。
Q1
> The core use case, intent, or business purpose for your use of the Twitter APIs
何に使うか教えろI will search the title of the song on Twitter
タイトル検索するわ
Q2
> If you intend to analyze Tweets, Twitter users, or their content, share details about the analyses you plan to conduct and the methods or techniques
どうやって使うんだ?I use the following API to search the song title by twitter
GET https://api.twitter.com/1.1/search/tweets.json
このAPIを使うわ
Q3
> If your use involves Tweeting, Retweeting, or liking content, share how you will interact with Twitter users or their content.
ツイートとリツイートはどのような感じ※で使うんだ?
I have no plans to use Tweeting, Retweeting
ツイートとリツイートも使わん
※おそらくどんな内容でツイートするか聞いてるっぽい
Q4
> If you’ll display Twitter content off of Twitter, explain how and where Tweets and Twitter content will be displayed to users of your product or service, including whether Tweets and Twitter content will be displayed at row level or aggregated
集計?行レベル?とりあえず具体例教えれI am assuming to use it in the same way as the attached imag
添付した画像みて。
返信から30分後。。。
Your Twitter developer account application has been approved!
意外に簡単!とりあえず、簡潔に簡単に伝えれば良いっぽい。
.NET Coreで最新バージョンのC#を扱う
.Net Coreでは何も指定しないとC#7.0しか使えません。こんなエラーが出ます。
Feature '新機能' is not available in C# 7.0. Please use language version 7.1 or greater.
7.1以上にあげなさい
7.1以上にあげる場合はcsprojに以下を記載します。
<LangVersion>7.1</LangVersion>
常に最新にしたい場合は「Latest」を指定。現在は7.3です。
<LangVersion>Latest</LangVersion>
C#は言語のバージョンによる影響が少ないので「Latest」で十分運用出来ると思います。非同期Main使えんなーと思ったらこれだったのね。
Azure App Serviceでgit submoduleが動くか
GithubからAzure App Serviceにデプロイする場合、ボタンポチポチで出来るのですがAzure App Service on LinuxだとちょっとKuduを弄らなければいけなかったので、同じようにgit submoduleもデプロイ時に取得してきてくれるのか確認してみました(Jenkinsとかちょっと工夫が必要なのでめんどい)。
git submoduleとは
外部の git リポジトリを、自分の git リポジトリのサブディレクトリとして扱える仕組みです。外部のリポジトリのブランチ単位でなく、コミット単位(CommitID)で管理するので初めて利用する人はちょっと手こずりますが理解出来ると結構便利な機能です。ちなみにsvn:externalsと同じように扱うと地獄なので、変更の少ないライブラリに利用するといいかもしれません。
Git - Submodules
git submoduleを用意する
配置したいディレクトリでsubmoduleを追加します。
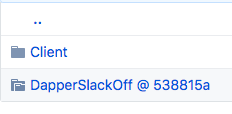
git submodule add {url}そしてgithubにpushすると以下のような感じになります。「@」の後ろはコミット番号になりますのでブランチは関係ありません。ちなみにDapperSlackOffは、Dapperの拡張ライブラリ(僕が作った)なので頻繁に変更するものではありません。DapperSlackOffはもうちょい安定したらブログに書きます。
submodule
デプロイする
デプロイ方法は前回書いた記事を参考にしてください。Windowsの場合は、スクリプトとアプリケーション設定がいりません。
tekitoumemo.hatenablog.com
結果
余裕でデプロイ出来た、動作も問題なし。

結論
Azure便利。submoduleは極力使わないが鉄。
Rechartsを使ってみたけどグラフの使い方って難しい。。
みんなの洋楽ランキングでランキングのグラフを作りたいと思ったのでRechartsに挑戦したけど、結局断念する結果となりそうです。いろんな要因があったので、使い方を含めここで説明しようかと思います。
ランキング形式に向いていない!(っぽい)
ランキングは10位→1位と数が小さくなるほどグラフが上に上がり、通常のグラフは数が大きくなるほとグラフが上に上がります(以下の画像参照)。
Rechartsでランキング形式にするには非常にめんどくさく、ごまかしながら実装する手法が必要のようです。Reactで実装したのですが、ざっと以下のようになりました。
import React, { Component } from "react"
import { LineChart, Line, XAxis, YAxis, CartesianGrid, Tooltip } from "recharts"

export class ChartRanking extends Component {
  render() {
    const data = [
      { name: '', 1: 1, 2: 2, 3: 3, 4: 4, 5: 5, 6: 6, 7: 7, 8: 8, 9: 9, 10: 10 },
      { name: "a", uv: 1 },
      { name: "b", uv: 3 },
      { name: "c", uv: 2 },
      { name: "d", uv: 4 },
      { name: "e", uv: 3 },
      { name: "f", uv: 2 },
      { name: "g", uv: 4 },
      { name: "h", uv: 5 }
    ]
    return (
      <div className="App">
        <LineChart width={600} height={500} data={data}>
          <XAxis dataKey="name" angle={90} height={90} textAnchor='start'/>
          <YAxis type="category" interval={0} />
          <CartesianGrid strokeDasharray="3 3" />
          <Tooltip />
          <Line dataKey="10" stroke="#ffffff" style={{ display: "none" }} />
          <Line dataKey="9" stroke="#ffffff" style={{ display: "none" }} />
          <Line dataKey="8" stroke="#ffffff" style={{ display: "none" }} />
          <Line dataKey="7" stroke="#ffffff" style={{ display: "none" }} />
          <Line dataKey="6" stroke="#ffffff" style={{ display: "none" }} />
          <Line dataKey="5" stroke="#ffffff" style={{ display: "none" }} />
          <Line dataKey="4" stroke="#ffffff" style={{ display: "none" }} />
          <Line dataKey="3" stroke="#ffffff" style={{ display: "none" }} />
          <Line dataKey="2" stroke="#ffffff" style={{ display: "none" }} />
          <Line dataKey="1" stroke="#ffffff" style={{ display: "none" }} />
          <Line dataKey="uv" stroke="#8884d8" />
        </LineChart>
      </div>
    )
  }
}
微妙①
かなりごまかしごまかしで実装する必要があります。
これとか↓
{ name: '', 1: 1, 2: 2, 3: 3, 4: 4, 5: 5, 6: 6, 7: 7, 8: 8, 9: 9, 10: 10 },
...
<Line dataKey="10" stroke="#ffffff" style={{ display: "none" }} />
<Line dataKey="9" stroke="#ffffff" style={{ display: "none" }} />
詳しい説明はココに書いてあります。
微妙②
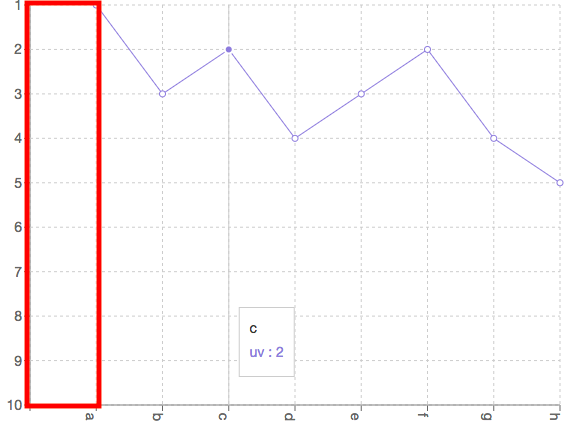
データの定義順序に依存しないためにダミーを入れてるので1列目が空白になっちゃう。
微妙③
これはRecharts関係ないですが、X軸が増えるとサイズが大きくなります。スマホだと横スクロールは微妙なので何列にするか制限かける必要があり非常に微妙です。
その他、Quitaに書いてなかったこと
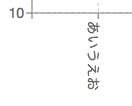
ラベルの開始位置?
textAnchor='start'
textAnchor='end'
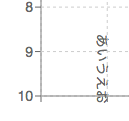
Y軸の間隔調整
// 数値が大きいほど間隔が大きくなる
interval={0}
結構機能は揃っているので、深掘りすればいい感じになるのかも知れませんがそこまでする必要がない理由が出てきました。
ランキングにグラフは不要
折れ線グラフは時間の経過に応じて変化する情報を見るものですが、ランキングは時間の変化によって読みとれる情報がほとんどないことがわかりました。例えば3位から1位に変化した場合に順位が上がったの要因が想像出来ません。それだとユーザーからみてなんとなくヒットしたんだろうなー程度の間隔で終わってしまうことが想像出来ました。
スマホには向かない
先ほども述べましたが、X軸が増えると横幅が大きくなります。そのために数を制限してグラフを作っても正しいデータじゃないのであまり意味がないと判断しました。ちなみに洋楽はトップ10に20周ランクインする曲が普通にあるのでX軸が増える可能性が高いのです。以下のようなスマホでグラフを実装してるアプリがありますが、やっぱりデータから読みとれる情報が少ないとあまり意味がなさないですね。
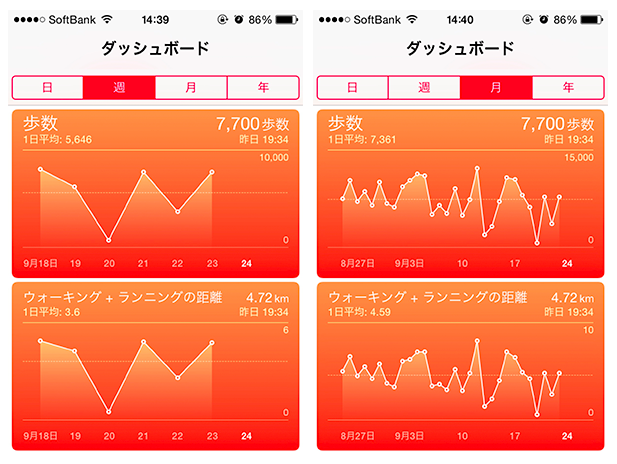
アップルのヘルスケアアプリですが、数値が低いとサポッたか体調が悪かったかなど読み取れます。
別にグラフじゃなくていいんじゃないかな
某ブログでエクセルで作ったグラフを乗っけているマニアの人がいて、いいなぁ〜と思いましたがユーザーからするとマニアックな情報なんてそうそう必要ないんじゃないかと思いました。みんなの洋楽ランキングの記事を見てくれた曲がどれだけヒットしているか知ってほしいので、グラフじゃなく数値で示せればある程度はいいのでは?と思いました。Spotifyのpopularityって項目はアーティストがどれだけ知名度があるか示している項目で100に近づけばだいたい知ってるよって指標になっています。あと、どれだけヒットしているか知ってほしい理由として注目されているものほど興味がわくという研究結果が出ている(どっかの記事でみた)ので他のページも見てくれるだろうと思っています。
なんかキュレーションサイトって簡単そうに見えて結構難しいんだなーと実感しました。
Azure SQL Databaseのスケールアップする方法

Azure SQL Databaseを調べると以下のような記事が出てきました。
えっ?ボタンポチポチでスケールアップ出来ないの!?
いやPaas使う意味!それどころかクラウド使う意味ねぇ!と思ったのでAzureいじったら簡単にスケールアップ出来ましたので、載せときます。
軽くプランについて
正直ここら辺は全く知らないけど、とりあえず2つの指標によって値段が変わります。ここで出てくるDTUとは以下の通りです。
DTUとは、SQL Database のデータベースの処理性能を表す単位であり、SQL Databaseにおける各サービスレベルの性能を表す為の指標の1つです。
DTUはベンチマークテストにより、弊社が独自で決めており、具体的には、各サービスレベルのCPU、メモリ、およびディスクの読み書きを組み合わせた測定に基づいて算出しております。
B1プラン
1DTU + 2Gまでで月600円ちょい
正直僕の運用しているみんなの洋楽ランキングレベルだと余裕です。たまに100%になってるのは夜間バッチで1500件ぐらいGRUD掛けてます。

Sプラン
100DTU(多分)+250Gまで
DTUによりけりだけど250Gの10DTUで2000円弱ぐらい。それなりのサービスで運用出来るだろう。
Pプラン
4000DTU+4Tまで
これ使うようになったら起業しましょう。
インフラは全然わからないし、やる気がしないのでPaasに全振りでお任せしたいのでスケールアップを調べました。Azureは簡単でかゆいところに手がとどくので使いやすいですね。でももっと楽に出来るサービス期待してる!


